Why Campaign Reporting Is Changing
Running ads and promotions on DoorDash takes real investment. You deserve a clear picture of what that investment is doing for your business.
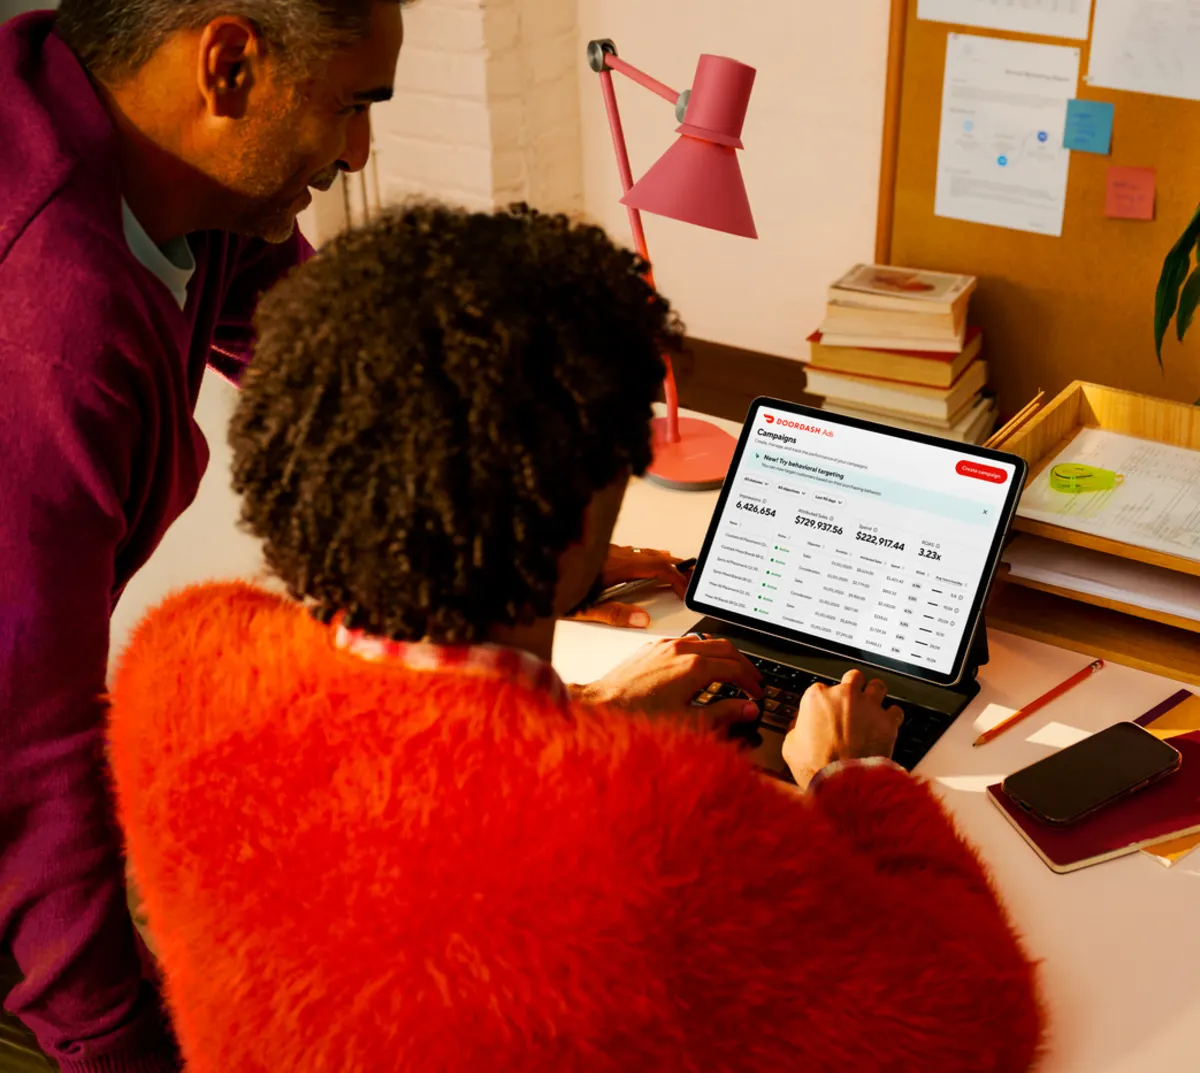
DoorDash is rolling out an updated campaign reporting experience in Merchant Portal. If you're seeing a new-look campaigns page, this article will walk you through what changed and how to use it. The new experience makes it easier to understand how your campaigns are performing — without having to piece together the story yourself. Instead of raw numbers you have to interpret on your own, you'll see three clear sections that answer the questions that matter most.
Where to View Campaign Performance in Merchant Portal
To see your campaign reports:
Log in to Merchant Portal
Go to the Ads & Promotions section
Select a campaign to view its performance details
You'll see the new reporting sections on your campaign page, alongside the campaign table you're already familiar with.

What the New Campaign Reporting Sections Mean
The updated experience adds three new sections to your campaigns page. Each one is designed to answer a specific question about how your campaign performed.
Here's a quick overview:
Section | What it answers |
|---|---|
Sales vs. Spend | Did my campaign drive sales? |
Reorder Rate | Did customers come back? |
LTV vs. Long-Term Cost | Were those customers worth the investment? |
Together, these sections help you move beyond raw numbers and understand the fuller story behind your campaign results.
How to Understand Sales vs. Spend

The Sales vs. Spend section shows how much in sales your campaign drove compared to what you spent on it.
This is a campaign performance view — it's not the same as your financial reports or payout statements, which track billing and payment activity separately. Think of it this way: Sales vs. Spend helps you understand your marketing results, while your financial reports show what you were charged and paid out.
What to look for:
If campaign sales are higher than your spend, it may indicate your campaign is driving meaningful sales relative to your investment.
If the numbers are closer together, it may be worth adjusting your campaign — whether that means changing the promotion type, the timing, or the budget
How to Understand Reorder Rate

Reorder Rate shows the percentage of customers acquired through your campaign who came back and ordered again — within 30, 60, or 90 days of their first order.
This helps you understand whether your campaign is bringing in customers who return, not just first-time buyers.
A higher reorder rate is a good sign. It means the customers your campaign brought in liked your restaurant enough to come back.
What to look for:
Compare reorder rates across different time windows (30, 60, and 90 days) to see how customer behavior changes over time
Campaigns with higher reorder rates may be worth continuing or increasing your investment in
How to Understand LTV vs. Long-Term Cost

LTV vs. Long-Term Cost compares the long-term value (LTV) — that is, how much revenue those customers generated over time — against what it cost to acquire them through your campaign.
LTV (long-term value) is a way of measuring how much a customer is worth to your business beyond their first order. When LTV is higher than your acquisition cost, it means the customers your campaign brought in have been generating enough value to justify the investment.
What to look for:
If LTV exceeds your long-term cost, your campaign is working well at bringing in valuable, returning customers
If they're close or reversed, it may be a sign to test a different campaign type or targeting approach
Why Some Metrics May Be Blank or Delayed
If you see a blank or "not yet available" message for Reorder Rate or LTV vs. Long-Term Cost, don't worry — this is normal for newer campaigns.
Both of these metrics look at what happens after customers are acquired through a campaign. That means they need time to calculate. For example:
Reorder Rate can only appear after enough time has passed for customers to come back and place a second order
LTV vs. Long-Term Cost requires even more history to accurately reflect customer value
If your campaign just ended — or is still running — these metrics may fill in over the coming weeks. Older campaigns with more data will show complete reporting sooner.
Ready to See How Your Campaigns Are Performing?
View your campaign performance in Merchant Portal.