You sit down to review your performance and find yourself drowning in a sea of spreadsheets and receipts. You know you've been busy, but how busy? Are your new menu items selling well? And how does this month compare to the same time last year?
Instead of spending a ton of time piecing together this puzzle, with a few clicks, you could uncover insights that not only show your current performance but can also help guide your future strategic decisions. This is how DoorDash's reporting tools can help.
Ready to make your numbers work for you? Let's dive in.
How can the Merchant Portal help me with my restaurant analytics?
Using restaurant analytics in the Merchant Portal can help you streamline operations and understand customer behaviors. By gathering these insights, you can tailor your offerings, boost sales, and improve overall performance, helping ensure your restaurant's success in a competitive market.
How can I use DoorDash data analysis to grow?
Here are a few ways you can transform customer insights into business growth:
Increase sales: Determine your restaurant's slowest days and times, then launch a campaign to drive traffic to your store during those windows. According to our 2025 Restaurant Online Ordering Trends Report, Friday and Saturday are the most popular days of the week for ordering food. If your restaurant analytics show the same trend, you can plan ahead for a busy day.
Improve your menu: You can use menu engineering to pinpoint the items that either enhance or detract from your overall profitability.
Acquire new customers: Find out the traits, locations, and preferences of your typical restaurant customer, then brainstorm ways to target similar people.
Drive loyalty: Get a breakdown of new and returning customers, then strategize ways to win back first-timers and entice existing customers to return (and bring friends!).
Improve guest experience: Understand what your customers like most about your restaurant (customizable menu offerings, trendy food, speedy service) , then highlight those features in your marketing campaigns.
Maximize marketing efforts: Identify which marketing channels attract the most customers and focus your advertising budget on the most effective ones.
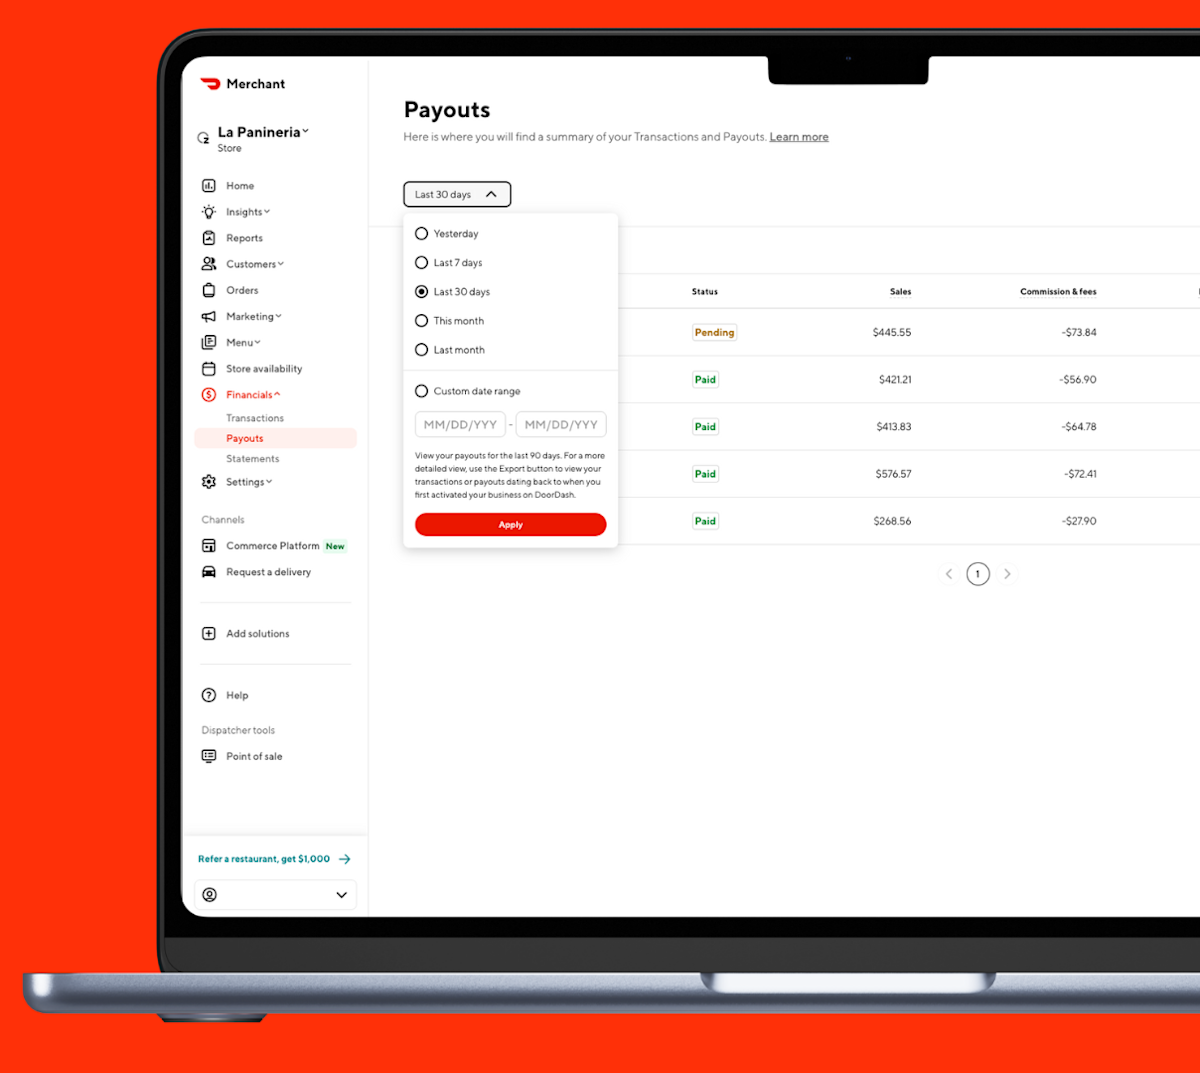
How do I view my payouts, statements, and other financial information?
If you’ve already added your banking information, check out How to Understand Your DoorDash Payout and Monthly Statement.
What is the report builder?
Report builder lets you build and schedule custom reports, allowing you to obtain valuable financial, sales, and operational data and insights about your business. Read more on how to use Report Builder in the Learning Center.
What are the benefits of using the report builder?
The report builder experience helps you find and create reports across multiple channels, including Marketplace, Online Ordering, Drive and more. Here are a few key benefits of using the report builder:
Customizable: You choose the metrics and reporting schedule based on your needs, including the ability to schedule automatic reports.
Comprehensive: Get insights into new and returning customer behavior and up to two years of operations, sales, and financial data.
Actionable: Create reports quickly and efficiently, helping you pull insights from your data to improve your business strategy.
How do I use the report builder?
By accessing report builder, you can download customized reporting, including: Operations, Sales, Financials, Marketing and more. To see how to access report builder or to understand access types check out How to Log In to the Merchant Portal.

Please note that only reports applicable to your operations will be available in the merchant portal.
On the Merchant Portal, select Reports on the left-hand menu bar.
Press the red Create report button on the top right.
Here, you can see the types of reports and what channels are available for each (Marketplace, Online Ordering, Drive On-Demand, etc).
Choose the type of report: Financial, Sales, Marketing, etc , then select Next. These reports include:
Financials Report: Transactions, error charges/adjustments, and payouts. You can learn more in How to Understand Your DoorDash Payout and Monthly Statement.
Operations Report: Order Accuracy, cancellation rate, wait time, product mix and more.
Sales Report: Sales, average ticket size, total orders, and comparisons across products such as DashPass, Marketplace, and Pickup. It can also help you analyze sales between new and returning customers.
Marketing Report: Return on Ad Spend (ROAS), customers reached (total, new, existing, DashPass users), average order value, advertising fee, average CPA (cost per acquisition) and more for Promo or Sponsored Listing campaigns. You can learn more about your marketing options in How to Use Ads & Promos.
If applicable: Customer Report: Customer name, contact information, and ordering trends (Available for Online Ordering only)
If applicable: Tax Report: Items sold and tax collected on those items
If applicable: Refund Report: Original order value, refund reason, and more.
Select a timeframe within the last two years and view by time, store, or order.
Adjust the report to include product and customer type if you want an extra level of detail.
Customize your report by picking either a One-time report or Recurring schedule.
Select Create report.
Once requested, you’ll receive an email confirming your report is in progress and another letting you know when it will be ready for download.
What is the Insights Hub?
The Insights Hub helps you access data to better understand your restaurant’s performance, meet customer needs, and potentially increase your sales. With this knowledge, you can focus on adjusting menus, operations, staffing, and more to reach new customers and, ultimately, grow your business.
How do I use the Insights Hub?
On the Merchant Portal, navigate to Insights on the left-hand menu bar.
Within the Insights Hub, you have access to 5 tabs:
Optimization score: An estimate of your store’s sales potential on DoorDash.
Learn more about How to Optimize Your Business on DoorDash.
Sales: Track sales by location, date, and time and see quick personalized charts that can support your decision making. Your sales insights can be filtered by day part, hour part and more! Sales insights is your visual representation of:
Gross sales
Total Orders
Average ticket size
Sales trends
Sales by channel and more.
Product Mix: Displays details about your most popular items with date and location filters.
Operations quality: Displays details on key operational metrics that customers care the most about with guidance on how to improve to positively increase your stores rating.
Read more about How to Prevent Avoidable Cancellations
Read more about How to Reduce Avoidable Wait Time
Read more about How to Improve Your Restaurant’s Downtime
Read more about How to Manage DoorDash Customer Reviews on the Merchant Portal
Most Loved (If applicable): Track your performance and understand how to get into this program designed to recognize and reward our most reliable merchants.
Read more about how to Become Most Loved on DoorDash.
Did DoorDash help your restaurant? Refer others near you!
If you know of small business restaurants (75 stores or fewer) in your area that aren’t on DoorDash, you can refer them and get a $1000 referral bonus when they sign up and complete 15 orders within 60 days.
What more tips to increase restaurant profits? Start by improving your service by heading over to How To Improve the Food Delivery Customer Experience.


